Kenyon Geetings
Professor Erik Insko
DATA-310 Data Visualization
20 September 2023
Design 1
I created a series of visualizations to explore the relationship between US gas prices and the political party in office, with a focus on inflation-adjusted gas prices. These visuals provide insights into how gas prices have evolved over time during different presidential administrations and whether there are significant differences between Democratic and Republican presidencies.
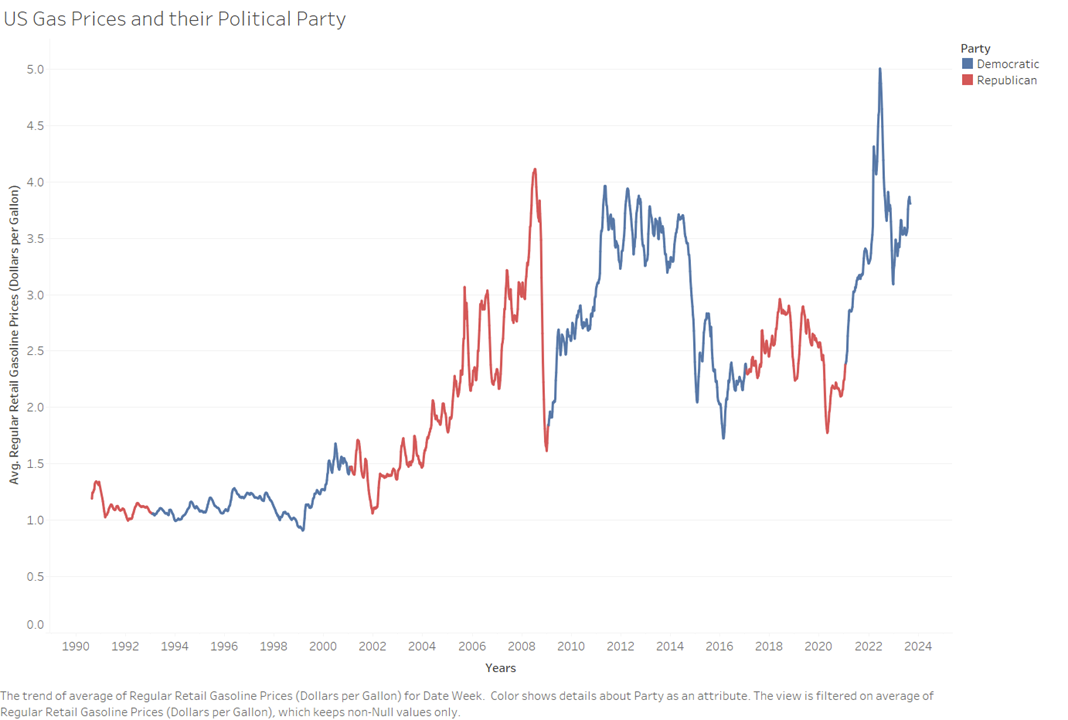
- Line Chart - Gas Prices and Political Party: This line chart shows the historical trend of US gas prices over the years, with colors indicating the political party in office at the time. By overlaying political party information on gas price data, viewers can observe whether there are any noticeable trends or patterns associated with a particular party's tenure in the White House.
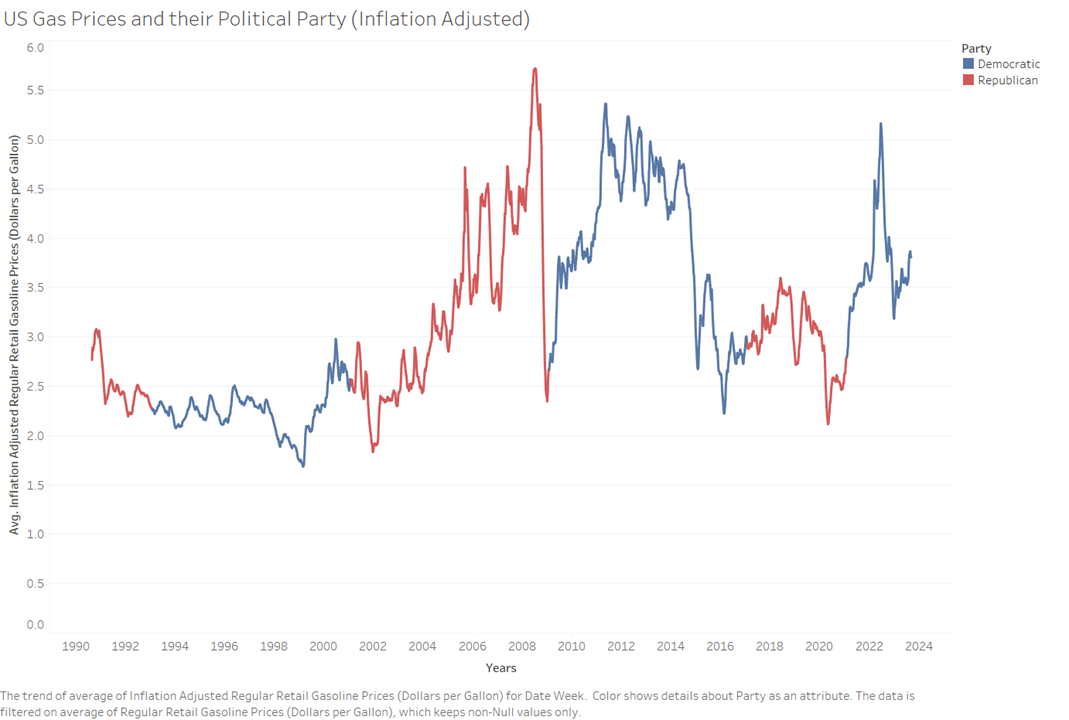
- Line Chart - Inflation-Adjusted Gas Prices: This line chart presents gas prices adjusted for inflation, allowing for a more accurate comparison of prices over time. Inflation-adjusted prices provide a clearer picture of how gas affordability has changed, considering changes in the overall purchasing power of the dollar.
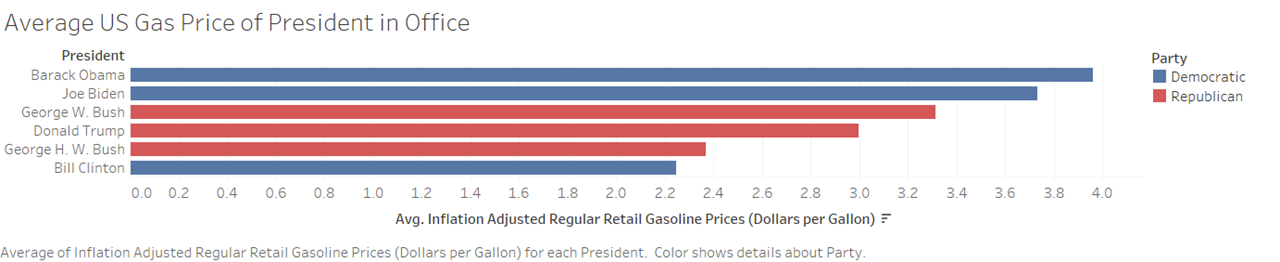
- Bar Chart - Average Gas Prices by President: The bar chart displays the average gas prices during each president's term. This chart allows viewers to easily compare the gas price performance of different presidents.
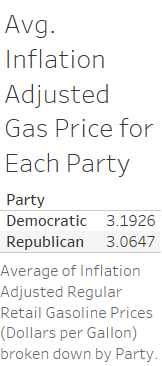
- Table - Average Inflation-Adjusted Gas Prices by Political Party: The table summarizes the average inflation-adjusted gas prices during Democratic and Republican presidencies. By presenting this data in a table, viewers can quickly discern that while there is a slight difference in average prices, it's relatively small (only a 13 cent difference).
These visualizations provide a comprehensive view of how gas prices have evolved in the United States in relation to the political party in power and inflation. While the data suggests a marginal difference in gas prices between Democratic and Republican administrations, it's clear that there are a multitude of other various factors that influence gas prices, such as global oil availability and economic conditions. These visualizations could serve as a starting point for a more in-depth analysis of the factors affecting gas prices and their political implications.